Top 4 Financial Close KPIs Your F&A Teams Should Be Tracking
Blog post
Share
Due to the COVID-19 pandemic, the need for real time financial information and insights is more important than ever to enable your organization to make critical decisions. However, many finance and accounting teams don’t have the necessary processes and technology in place to provide their leadership teams with the correct insight needed to drive immediate business decisions. This blog is based on a Trintech webinar that discusses the financial close KPIs that finance and accounting teams must be tracking, and how automation enables organizations to utilize these KPIs to lead their business into the future.
When managing financial close metrics, accountants want to look holistically at the overall process to make sure that all the close components are aligned and measure the data elements that are most important to leadership and the integrity of the financial reports. Stepping back to actually look at the sum of all the parts of the financial close will help finance and accounting teams move away from simply viewing the metrics as raw information that the organization might have already known about, to reading into that data to gain the financial insights to be able to move the company forward.
![“These particular things may be symptoms to actually understanding what is required for us to know to measure success… the combination of all of these together is really what enables you to measure the overall quality of your close. We do not just want to focus on making the [close] process faster. We want to do the process better. Also, if you have the ability, to be able to free you and your department up to take on the things that you've been putting on the sideline, [this will help] to really move the business forward.” -Cody Koetter, Senior Director of Global Product Management *Trintech*](https://www.trintech.com/wp-content/uploads/2023/01/WC-IM-NA-MM-CodyKoetterKPIQuote-2.jpg)
Financial Close Monitoring Metrics
In measuring the effectiveness of the close, it’s important to measure timeliness both empirically and relative to each other. Finance teams should also track the frequency at which unexpected or blocking events occur, and these “issues” provide insight into how to improve the process and are great markers for the quality of the current documented process, and gives accountants the ability to understand if changes to the process should be implemented.
Reconciliation & Journal Entry Metrics
Reconciliation and Journal Entry metrics tend to have similar challenges as close monitoring. Measuring aged items is very common because it defines risk, but finance teams should also be measuring the trend over time. As an example, how often are things aging out 90 days? As much as organizations would like to believe that they have a good handle on items that are being aged out 30, 60, 90 days, 120 days, or whatever their policy may be, that isn’t always true. What organizations are really finding is that they have a view of what they know, but there are a lot of things that are aging out on their balance sheet—or should be aging on their balance sheet—that they’re completely unaware of.
Compliance & Audit Metrics
Adding financial close KPIs around the compliance and audit process is an effective way to discover the quality of work the office of finance is doing in the month-to-month and quarter-to-quarter activities. “Cost of Compliance” is a key metric that is often forgotten until an issue arises. However, this often encapsulates aspects like the cost of remediation and retesting, the loss of time, opportunity costs, and the following cost of documenting the problematic event. The best performing companies know that when an issue or potential blocker arises, they need to react quickly to assess the impact of the event or remediate any process shortcomings which is why “Issue Time to Resolution” is a key metric to track. In addition, many companies like to test once and comply across multiple compliance initiatives. However, this becomes an issue if the company is growing significantly. A “Control Test Rate” metric allows organizations to focus on managing and implementing those controls across the entire businesss.
How the Adra Suite Can Effectively Measure and Track these KPIs
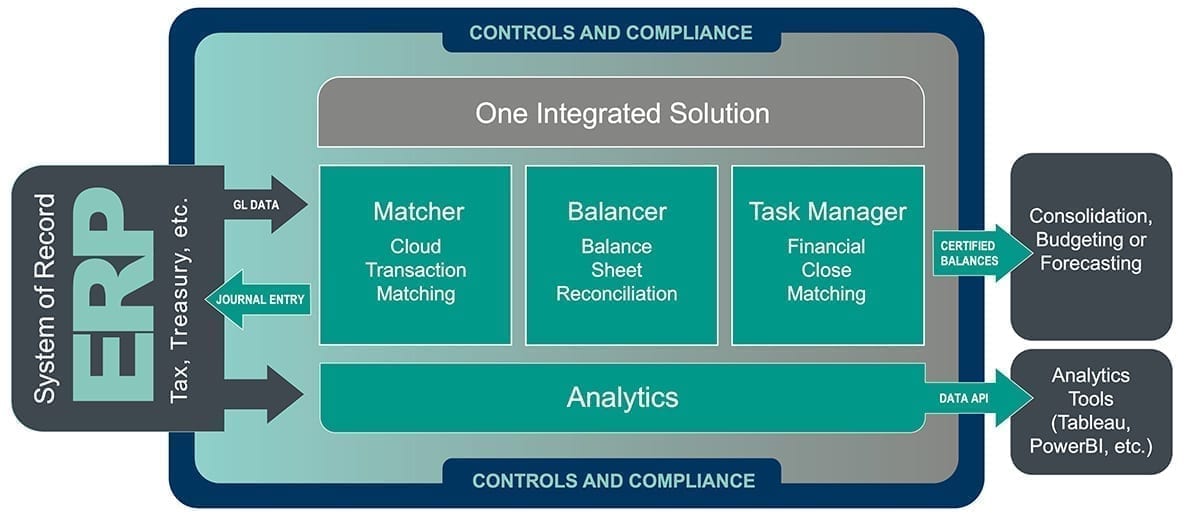
The Adra Suite is an integrated, end-to-end solution that starts with Adra Matcher. Matcher records the transaction and matches it— whether to a bank statement, the General Ledger, or credit card statement— then looks at higher risk accounts with significant volume that may impact cash. An automated matching solution not only helps streamline the process, but also works to de-risk it with controls. The items that have matched then automatically flow in to substantiate the balance sheet reconciliation inside of Adra Balancer. At the same time, Adra Task Manager documents the pre-close, close and post-close activities, as well as compliance.
The last tool layered in the close process is Adra Analytics, which allows leadership to visualize the entire financial close process. This allows finance teams to look at specific close aspects such as the amount of time it takes the team to reconcile high-risk accounts, the average amount of time it takes to prepare a specific account, the risk level of each task, how long each account takes to be approved, and more. These products can function separately or as a full end-to-end solution.
To learn more about the financial close KPIs your organizations should be tracking, watch the on-demand webinar.
Written By: Ashton Mathai


